Single Infographic
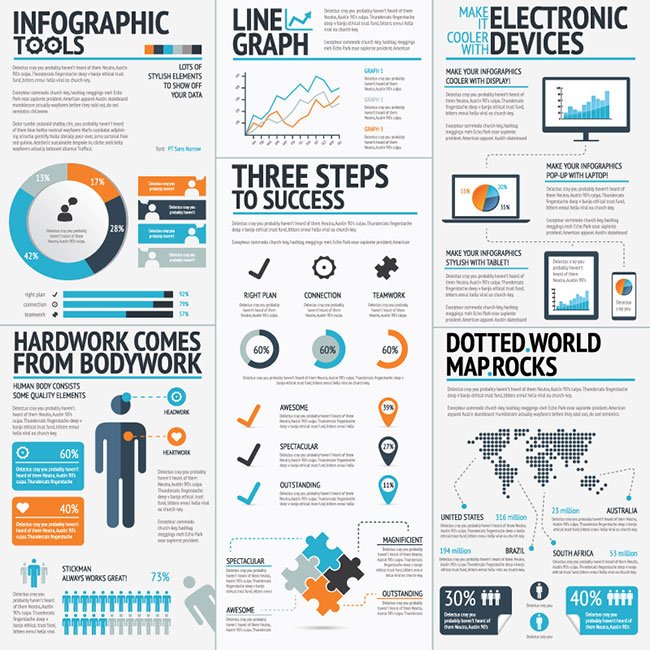
Bring life to your reporting in the form of an infographic. Numbers, data, KPI’s, etc., can be dull and cumbersome to review. Give yourself and your audience a story in colorful, eye-catching graphics.
*Upon completion of your order, within 24 hours you will receive a link to a DropBox folder. In the DropBox, you will be able to upload all relevant files of the information & data you’d like to have included in your report. If there is qualitative information to include in your report, it is recommended that you include that information in the files you upload.
**All reports/infographics reflect descriptive data/statistics. CalcX does not provide predictive or prescriptive analytics services. To learn more about descriptive, predictive, or prescriptive analytics, check out CalcX - School of Excellence on YouTube.

